0.175keV,共同温度keV, common temperature
键盘操作Keyboard
| → space PgDn | 下一张 / 点击画面Next slide / click the slide |
| ← PgUp | 上一张Previous slide |
| Home End | 第一张 / 最后一张First / last slide |
| s | 显示/隐藏讲稿Show/hide the script |
| p | 演示者视图(当前页 + 讲稿 + 下一页 + 计时)Presenter view (current + script + next + timer) |
| ? | 本帮助This help |
| Esc | 退出演示者视图/帮助Leave presenter view / help |
?print | 打印视图:幻灯片 + 完整讲稿(浏览器打印为 PDF)Print view: slides + full script (browser print to PDF) |
英文为规范讲稿;中文为忠实翻译。按 ? 或 Esc 关闭。English is the canonical script; Chinese is a faithful translation. Press ? or Esc to close.
星系丢了一半重子:它们应该在 10 万度的热晕里,却极难测Galaxies Are Missing Half Their Baryons, and the Missing Gas Should Be a \(10^{6}\) K Halo That Is Very Hard to Measure
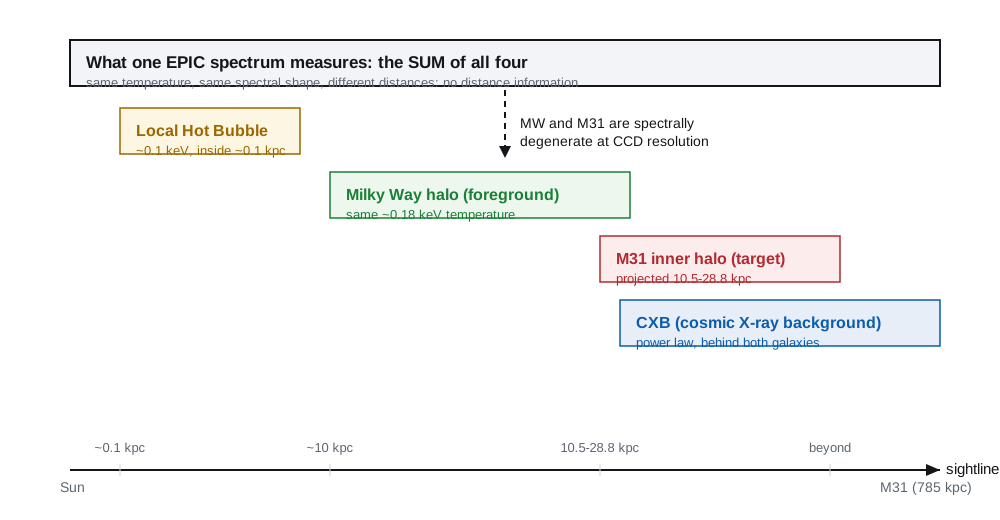
问题:The problem:
M31 是唯一能在 10–30 kpc 用分开的视线测绘其内晕的 L* 星系。但同一视线上还有银河系晕、本地热气泡和宇宙 X 射线背景,温度几乎相同。M31 is the only L* galaxy whose inner halo we can map at 10–30 kpc with resolved sightlines. But the same sightline also holds the Milky Way halo, the Local Hot Bubble and the cosmic X-ray background, all at almost the same temperature.
2 / 1引入Hook
讲稿SCRIPT
Start with the reason anyone cares. Simulations of galaxy formation say that a large spiral should be holding a substantial fraction of its baryons in a hot halo, at around a million degrees. We have never accounted for it in any single galaxy, and the X-ray signal from such gas is faint and sits on top of everything else in the same direction. M31 is the one nearby L* galaxy where we can actually place many separate sightlines across its inner halo, from 10 to 30 kiloparsecs. The catch, and this is the whole reason this project is hard, is that along each of those sightlines we also have the Milky Way's own hot halo, a nearby bubble of hot gas around the Sun, and the cosmic X-ray background. And at the resolution of the EPIC cameras, those components have nearly the same temperature and therefore nearly the same spectral shape.
先说为什么有人关心。星系形成模拟说,一个大的旋涡星系应当把相当一部分重子保存在约百万度的热晕里。我们在任何单个星系中都没有把这部分气体数清楚,而且这种气体的 X 射线信号很弱,还叠在同一方向的其他一切之上。M31 是附近唯一一个 L* 星系,我们可以在它内晕上放置许多互相分开的视线,从 10 到 30 千秒差距。麻烦在于——这也是整个课题困难的原因——每一条视线上还有银河系自己的热晕、太阳附近的一个热气泡,以及宇宙 X 射线背景。而在 EPIC 相机的分辨率下,这些成分的温度几乎相同,因此光谱形状也几乎相同。
cumulative 1:00 / 45:00
路线图:为什么难 → 我们怎么测 → 三个结论 → 保留意见 → 总结Roadmap: Why It Is Hard → How We Measured → Three Findings → Caveats → Summary
1. 背景:EPIC 能看到什么,粒子背景与软质子为什么限制弥漫发射测量。1. Background: what EPIC can see, and why the particle and soft-proton backgrounds limit diffuse-emission work.
2. 数据与方法:22 个视场、14 个主样本、模型与拟合方式。2. Data and method: 22 pointings, the 14-field primary sample, the model and how it was fitted.
3. 结果:共同的 0.175 keV 成分、总量、平的轮廓、集中晕的上限。3. Results: the common 0.175 keV component, the total, the flat profile, the limit on a concentrated halo.
4. 讨论:与银河系前景模型的一致性检验,以及它排除了什么。4. Discussion: a consistency test against Milky Way foreground models, and what it excludes.
5. 保留意见、待定项、总结。5. Caveats, pending items, summary.
4 / 1路线图Outline
讲稿SCRIPT
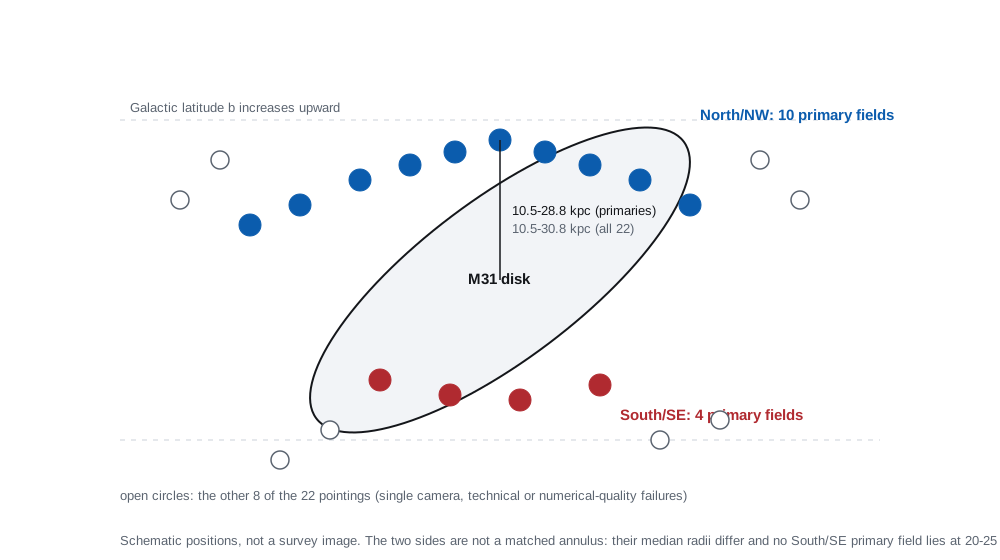
The roadmap. I will spend about eight minutes on background, because the difficulty is the interesting part. Then the data and the method, which is the minimum you need in order to trust the number. Then the results, in the order that builds the answer: first that there is one common soft component, then its total, then that the profile is flat, then what that implies for a concentrated halo. Then a discussion section where I compare with published Milky Way foreground models, and I will be explicit about what that comparison can and cannot say. Finally the caveats, the things that are still pending, and a summary. On the right you can already see the geometry: two chains of pointings along the minor axis, not a complete annulus. That asymmetry matters later, so keep it in mind.
路线图如下。背景大约八分钟,因为困难本身是有趣的部分。然后是数据和方法,这是你信任这个数字所需的最少信息。接着是结果,顺序是按照构建答案的需要:先说存在一个共同的软成分,然后是它的总量,然后是轮廓是平的,然后说明这对一个集中的晕意味着什么。然后是讨论,我把结果与已发表的银河系前景模型比较,并明确说明这个比较能说什么、不能说什么。最后是保留意见、待定项和总结。右边你已经能看到几何形状:沿短轴的两串视场,而不是一个完整的环。这种不对称后面很重要,先记住。
cumulative 3:00 / 45:00
一台 X 射线望远镜测的是计数,不是通量:响应、有效面积与背景都必须一起建模An X-Ray Telescope Measures Counts, Not Flux: Response, Effective Area and Backgrounds Must All Be Modelled Together
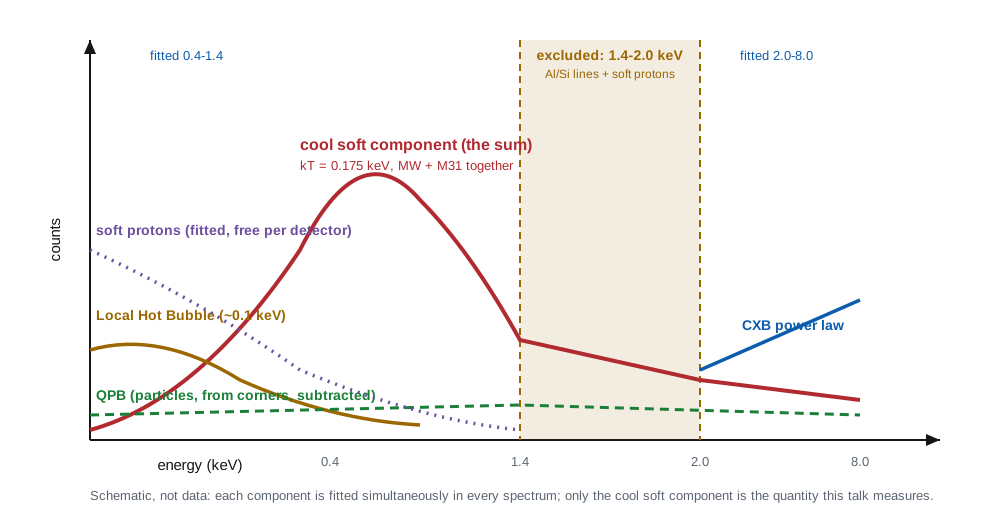
一次观测给出四个配套谱:天体源谱、准静止粒子背景(QPB,从探测器边角测得)、有效面积(ARF)与响应矩阵(RMF)。One observation gives four matched products: the source spectrum, the quiescent particle background (QPB, measured from the detector corners), the effective area (ARF) and the response matrix (RMF).
QPB 是粒子背景,不是天空谱;软质子必须当作自由成分拟合。The QPB is a particle background, not a sky spectrum; soft protons must be fitted as free components.
5 / 1背景Background
讲稿SCRIPT
A 30-second reminder of what the instrument gives you. An X-ray camera does not measure a flux. It measures counts in energy channels, and to turn counts into a physical surface brightness you need the effective area and the response matrix, which redistribute and absorb photons. Alongside the source spectrum, the standard ESAS-style reduction gives you a quiescent particle background spectrum, measured from the detector corners, and it is important to be clear that this is a particle background, not a blank-sky spectrum. It is not the sky. The remaining spectrum still contains celestial emission plus residual detector background and soft protons, and those soft protons have to be fitted explicitly, because their shape is not known in advance. The figure is schematic. The point is that all of these are fitted at once in every single spectrum, and only the cool soft component is the quantity this talk is about.
用 30 秒提醒一下仪器给你什么。X 射线相机测的不是通量,而是能量道里的计数;要把计数变成物理面亮度,你需要有效面积和响应矩阵,它们会重新分配并吸收光子。与源谱一起,标准 ESAS 式归约还给出一个准静止粒子背景谱,从探测器边角测得;必须说清楚这是粒子背景,不是空白天区谱,它不是天空。剩下的谱仍然包含天体辐射、残余探测器背景和软质子,而软质子必须显式拟合,因为它的形状事先未知。这张图是示意图。重点是这些都在每一个谱里同时拟合,而只有那个冷的软成分是本报告要测的量。
One more point about this slide, because it explains why the field moves slowly. Every one of those components has free parameters, and they are all fitted together in a single spectrum. That means the uncertainty on the cool component is not just counting statistics: it is the joint uncertainty of everything else in the model. That is also why we spend effort on the fitting procedure rather than only on data volume. A deeper exposure does not help if the model is wrong.
关于这张幻灯片还有一点,因为它解释了这个领域为什么进展慢。上面每个成分都有自由参数,而且它们在同一个谱里一起拟合。这意味着冷成分的不确定性不只是计数统计:它是模型中其他一切的联合不确定性。这也是为什么我们把精力花在拟合程序上,而不只是数据量上。如果模型是错的,更深的曝光也没有用。
cumulative 5:00 / 45:00
银河系与 M31 的热谱在 CCD 分辨率下几乎相同,因此只有空间形状能分开它们Milky Way and M31 Thermal Spectra Are Nearly Identical at CCD Resolution, So Only Spatial Shape Can Separate Them
一个约 0.175 keV 的热等离子体谱由少数几条发射线加连续谱决定;两个不同距离、相同温度的成分给出同一形状。A ~0.175 keV thermal plasma spectrum is set by a few emission lines plus a continuum; two components at the same temperature but different distances give the same shape.
因此我们把拟合成分当作视线和(代码里叫 MWhalo),而不是任何一个星系。We therefore treat the fitted component as a line-of-sight sum (called MWhalo in the code), not as either galaxy.
6 / 1背景Background
讲稿SCRIPT
This is the central physical difficulty, and I want to be very clear about it. At these temperatures, around 0.175 keV, the spectrum of a thermal plasma is dominated by a handful of emission lines sitting on a continuum, and the shape is essentially set by the temperature. If I put two plasmas at the same temperature along the same sightline, at completely different distances, the detector sees one shape. If I let the fit have two free components at nearly the same temperature, the optimiser can divide the normalisation between them arbitrarily and get an equally good fit. That division would carry no distance information. So the honest thing to do, and what we do, is to fit one shared component and call it what it is: the sum along the line of sight. In the fitting code that component is named MWhalo, which is a historical label from an earlier Milky-Way-facing model; it carries no distance information, and I will keep saying "the sum" to avoid that confusion.
这是核心的物理困难,我想说清楚。在这个温度附近,约 0.175 keV,热等离子体谱由少数几条发射线加连续谱主导,形状基本由温度决定。如果我把两个温度相同、距离完全不同的等离子体放在同一视线上,探测器看到的是一个形状。如果让拟合有两个温度几乎相同的自由成分,优化器可以任意分配两者的归一化,并得到同样好的拟合。那种分配不携带任何距离信息。所以诚实的做法——也正是我们做的——是拟合一个共享成分,并把它叫做它本来的样子:沿视线的和。在拟合代码里这个成分叫 MWhalo,这是早期面向银河系的模型留下的历史名字,不携带距离信息;我会一直说"和",以避免这个混淆。
cumulative 6:30 / 45:00
我们在 0.4–1.4 与 2.0–8.0 keV 拟合,中间挖掉 1.4–2.0 keV,因为那里是仪器线与软质子We Fit 0.4–1.4 and 2.0–8.0 keV and Cut Out 1.4–2.0 keV, Where the Instrumental Lines and Soft Protons Live
MOS 的 Al 与 Si K \(K\alpha\) 仪器线落在 1.4–2.0 keV,该段对残余软质子也最敏感。The MOS Al and Si K \(K\alpha\) instrumental lines fall in 1.4–2.0 keV, and that interval is also the most sensitive to residual soft protons.
被排除的能段只占冷成分流量的 0.37 %,所以 0.5–2 keV 比较带的绝大部分来自直接拟合的道。The excluded band carries only 0.37 % of the cool component's flux, so the 0.5–2 keV comparison band rests almost entirely on directly fitted channels.
7 / 1背景Background
讲稿SCRIPT
One technical choice you need in order to trust the numbers. We do not fit the whole MOS band. The interval from 1.4 to 2 keV contains the aluminium and silicon instrumental lines of the camera itself, and it is also the region most sensitive to residual soft protons, so we cut it out and fit two disjoint intervals, 0.4 to 1.4 and 2.0 to 8 keV. Now, the headline number I will show you is quoted in the 0.5 to 2 keV band, because that is the band the literature uses, so a fair question is how much of that band is extrapolated across the hole. The answer is reassuring and quantified: the whole interval above 1.25 keV, which strictly contains the excluded gap, contributes only about half a percent of the model flux at the fitted temperature. So the comparison band is not carried by extrapolation. I will come back to one caveat about this exclusion on the caveats slide, because it is not entirely free.
有一个技术选择你需要知道才能信任这些数字。我们不拟合整个 MOS 能段。1.4 到 2 keV 之间包含相机自身的铝和硅仪器线,而且这一区间对残余软质子也最敏感,所以我们把它挖掉,拟合两个不连续的区间:0.4–1.4 和 2.0–8.0 keV。那么,我要给你看的头条数字是用 0.5 到 2 keV 能段报的,因为文献都用这个能段,所以一个合理的问题是:这个能段有多少是从洞里外推出来的。答案令人放心且已量化:在拟合温度下,整个 1.25 keV 以上区间——它严格包含被排除的间隙——只贡献约半个百分点的模型流量。所以比较带不是靠外推支撑的。关于这个排除,我还会在保留意见那一页回到一个警告,因为它并非完全没有代价。
cumulative 8:00 / 45:00
22 个视场里只有 14 个进入主样本,选择规则与流量无关Of 22 Pointings Only 14 Enter the Primary Sample, and the Selection Rules Do Not Depend on Flux
XMM 大型课题 080073(New-ANGELS 的光晕指向),10.5–30.8 kpc。XMM large programme 080073 (the halo pointings of New-ANGELS), 10.5–30.8 kpc.
20 个可恢复拟合、18 个通过技术校验、14 个双 MOS 主样本(10 北/西北 + 4 南/东南)。20 restorable sessions, 18 passing technical validation, 14 dual-MOS primaries (10 North/NW + 4 South/SE).
只用 MOS:pn 的边角粒子背景尚未通过同等校验。MOS only: the pn corner particle background has not passed an equivalent validation.
8 / 1数据Data
讲稿SCRIPT
The data. These are the halo pointings of the New-ANGELS legacy survey on XMM-Newton, large programme 080073, sampling projected radii from 10.5 to 30.8 kiloparsecs. We attempted all 22 pointings, and then applied quality rules that do not look at the fitted flux at all. Twenty pointings produced restorable fitting sessions, eighteen passed the full technical validation, and fourteen have both MOS cameras and enter the primary sample: ten on the North and North-West side, four on the South and South-East side. The sample is MOS only. That is a deliberate choice with a documented reason: the pn camera's quiescent particle background, in this regime of short exposures, is limited by corner statistics and out-of-time events, and we do not yet have an equivalently validated pn background set for the whole sample. This is a product-readiness decision about our pn reduction, not a claim that pn data are unusable in general.
数据方面。这是 XMM-Newton 上 New-ANGELS 遗产巡天 080073 大型课题的光晕指向,采样投影半径 10.5 到 30.8 千秒差距。我们尝试了全部 22 个指向,然后施加完全不看拟合流量的质量规则。20 个指向产生了可恢复的拟合会话,18 个通过完整技术校验,14 个同时有 MOS1 和 MOS2 并进入主样本:北和西北侧 10 个,南和东南侧 4 个。样本只用 MOS。这是一个有文档依据的刻意选择:pn 相机的准静止粒子背景在这种短曝光情形下受边角统计和 out-of-time 事件限制,而我们还没有为整个样本准备好通过同等校验的 pn 背景集。这是关于我们 pn 归约的产品成熟度决定,不是说 pn 数据一般不可用。
One honest note on the sample size. Fourteen fields sounds small, and it is. The reason we did not simply add more pointings is that the archival fields beyond 30 kiloparsecs are not comparable: they have mixed filters, unrelated targets, and no matched background products. Adding them would increase the count and decrease the trustworthiness at the same time. That is why the outer sample is being re-extracted rather than borrowed.
关于样本量说一句实话。十四个视场听起来小,确实也小。我们没有简单增加更多指向的原因是:30 千秒差距以外的档案视场不可比,它们滤光片混杂、目标无关、也没有匹配的背景产品。加进去会增加数量同时降低可信度。这就是为什么外场样本是重新抽取而不是借用。
cumulative 11:00 / 45:00
每个视场独立拟合:天空成分跨两台相机联动,仪器成分各自自由Each Pointing Is Fitted Independently: Sky Components Are Linked Across the Two Cameras, Instrumental Components Stay Free
模型成分:本地热气泡(~0.1 keV)、冷软成分 = 视线和、热成分(0.7 keV)、宇宙 X 射线背景(幂律)、软质子(断幂律)、仪器线。Components: the Local Hot Bubble (~0.1 keV), the cool soft component = the line-of-sight sum, a hot component (0.7 keV), the cosmic X-ray background (power law), soft protons (broken power law), instrumental lines.
银河系氢柱密度 N_H 逐点取自 HI4PI 地图;软质子与仪器线每台探测器单独自由。The Galactic hydrogen column N_H is taken per pointing from the HI4PI map; soft protons and instrumental lines are free per detector.
统计量:Gehrels \(\chi^{2}\);温度与归一化用轮廓似然取区间,不是局部协方差。Statistic: Gehrels chi-square; temperature and normalisation intervals come from profile likelihood, not local covariance.
9 / 1方法Method
讲稿SCRIPT
The method, briefly. Every pointing is fitted on its own, with no parameter linked between different pointings. Within one pointing, the sky components are linked between MOS1 and MOS2, because they see the same sky, while the instrumental components, the residual line and the soft proton continuum, are free per detector, because they are detector properties. The Galactic absorption column is taken per pointing from the HI4PI hydrogen map, so each field gets its own column. Two details that matter for trusting the error bars. We use the Gehrels chi-square statistic, which is the right choice for low counts. And for the temperature and the normalisation we use profile likelihood intervals with multistart, not the local covariance approximation, because the normalisation is bounded below at zero and the local approximation is not valid at that boundary.
方法简述。每个指向单独拟合,不同指向之间不链接任何参数。在一个指向内,天空成分在 MOS1 和 MOS2 之间联动,因为它们看的是同一片天空;而仪器成分、残余线和软质子连续谱每台探测器单独自由,因为它们是探测器属性。银河系吸收柱密度逐点取自 HI4PI 氢地图,所以每个视场有自己的柱密度。有两个细节对信任误差棒很重要。我们用 Gehrels \(\chi^{2}\) 统计量,这对低计数是正确的选择。对温度和归一化,我们用带多重起点的轮廓似然区间,而不是局部协方差近似,因为归一化在零处有下界,而局部近似在那个边界附近无效。
Why multistart matters here is worth one sentence. The likelihood surface for these spectra has more than one local minimum, and a single starting point can land in the wrong one. So every node on the profile is fitted from at least ten different starting points, and only the best is kept. That is also why the headline number changed when we moved from a single-start to a multistart analysis: the same data, the same model, a different and better answer.
为什么多重起点在这里重要,值得一句话说明。这些谱的似然面有不止一个局部极小,单一起始点可能落进错误的那一个。所以轮廓上每个节点都从至少十个不同起始点拟合,只保留最好的。这也是为什么我们从单起点转到多重起点分析时头条数字会变:同样的数据、同样的模型,一个不同且更好的答案。
cumulative 13:30 / 45:00
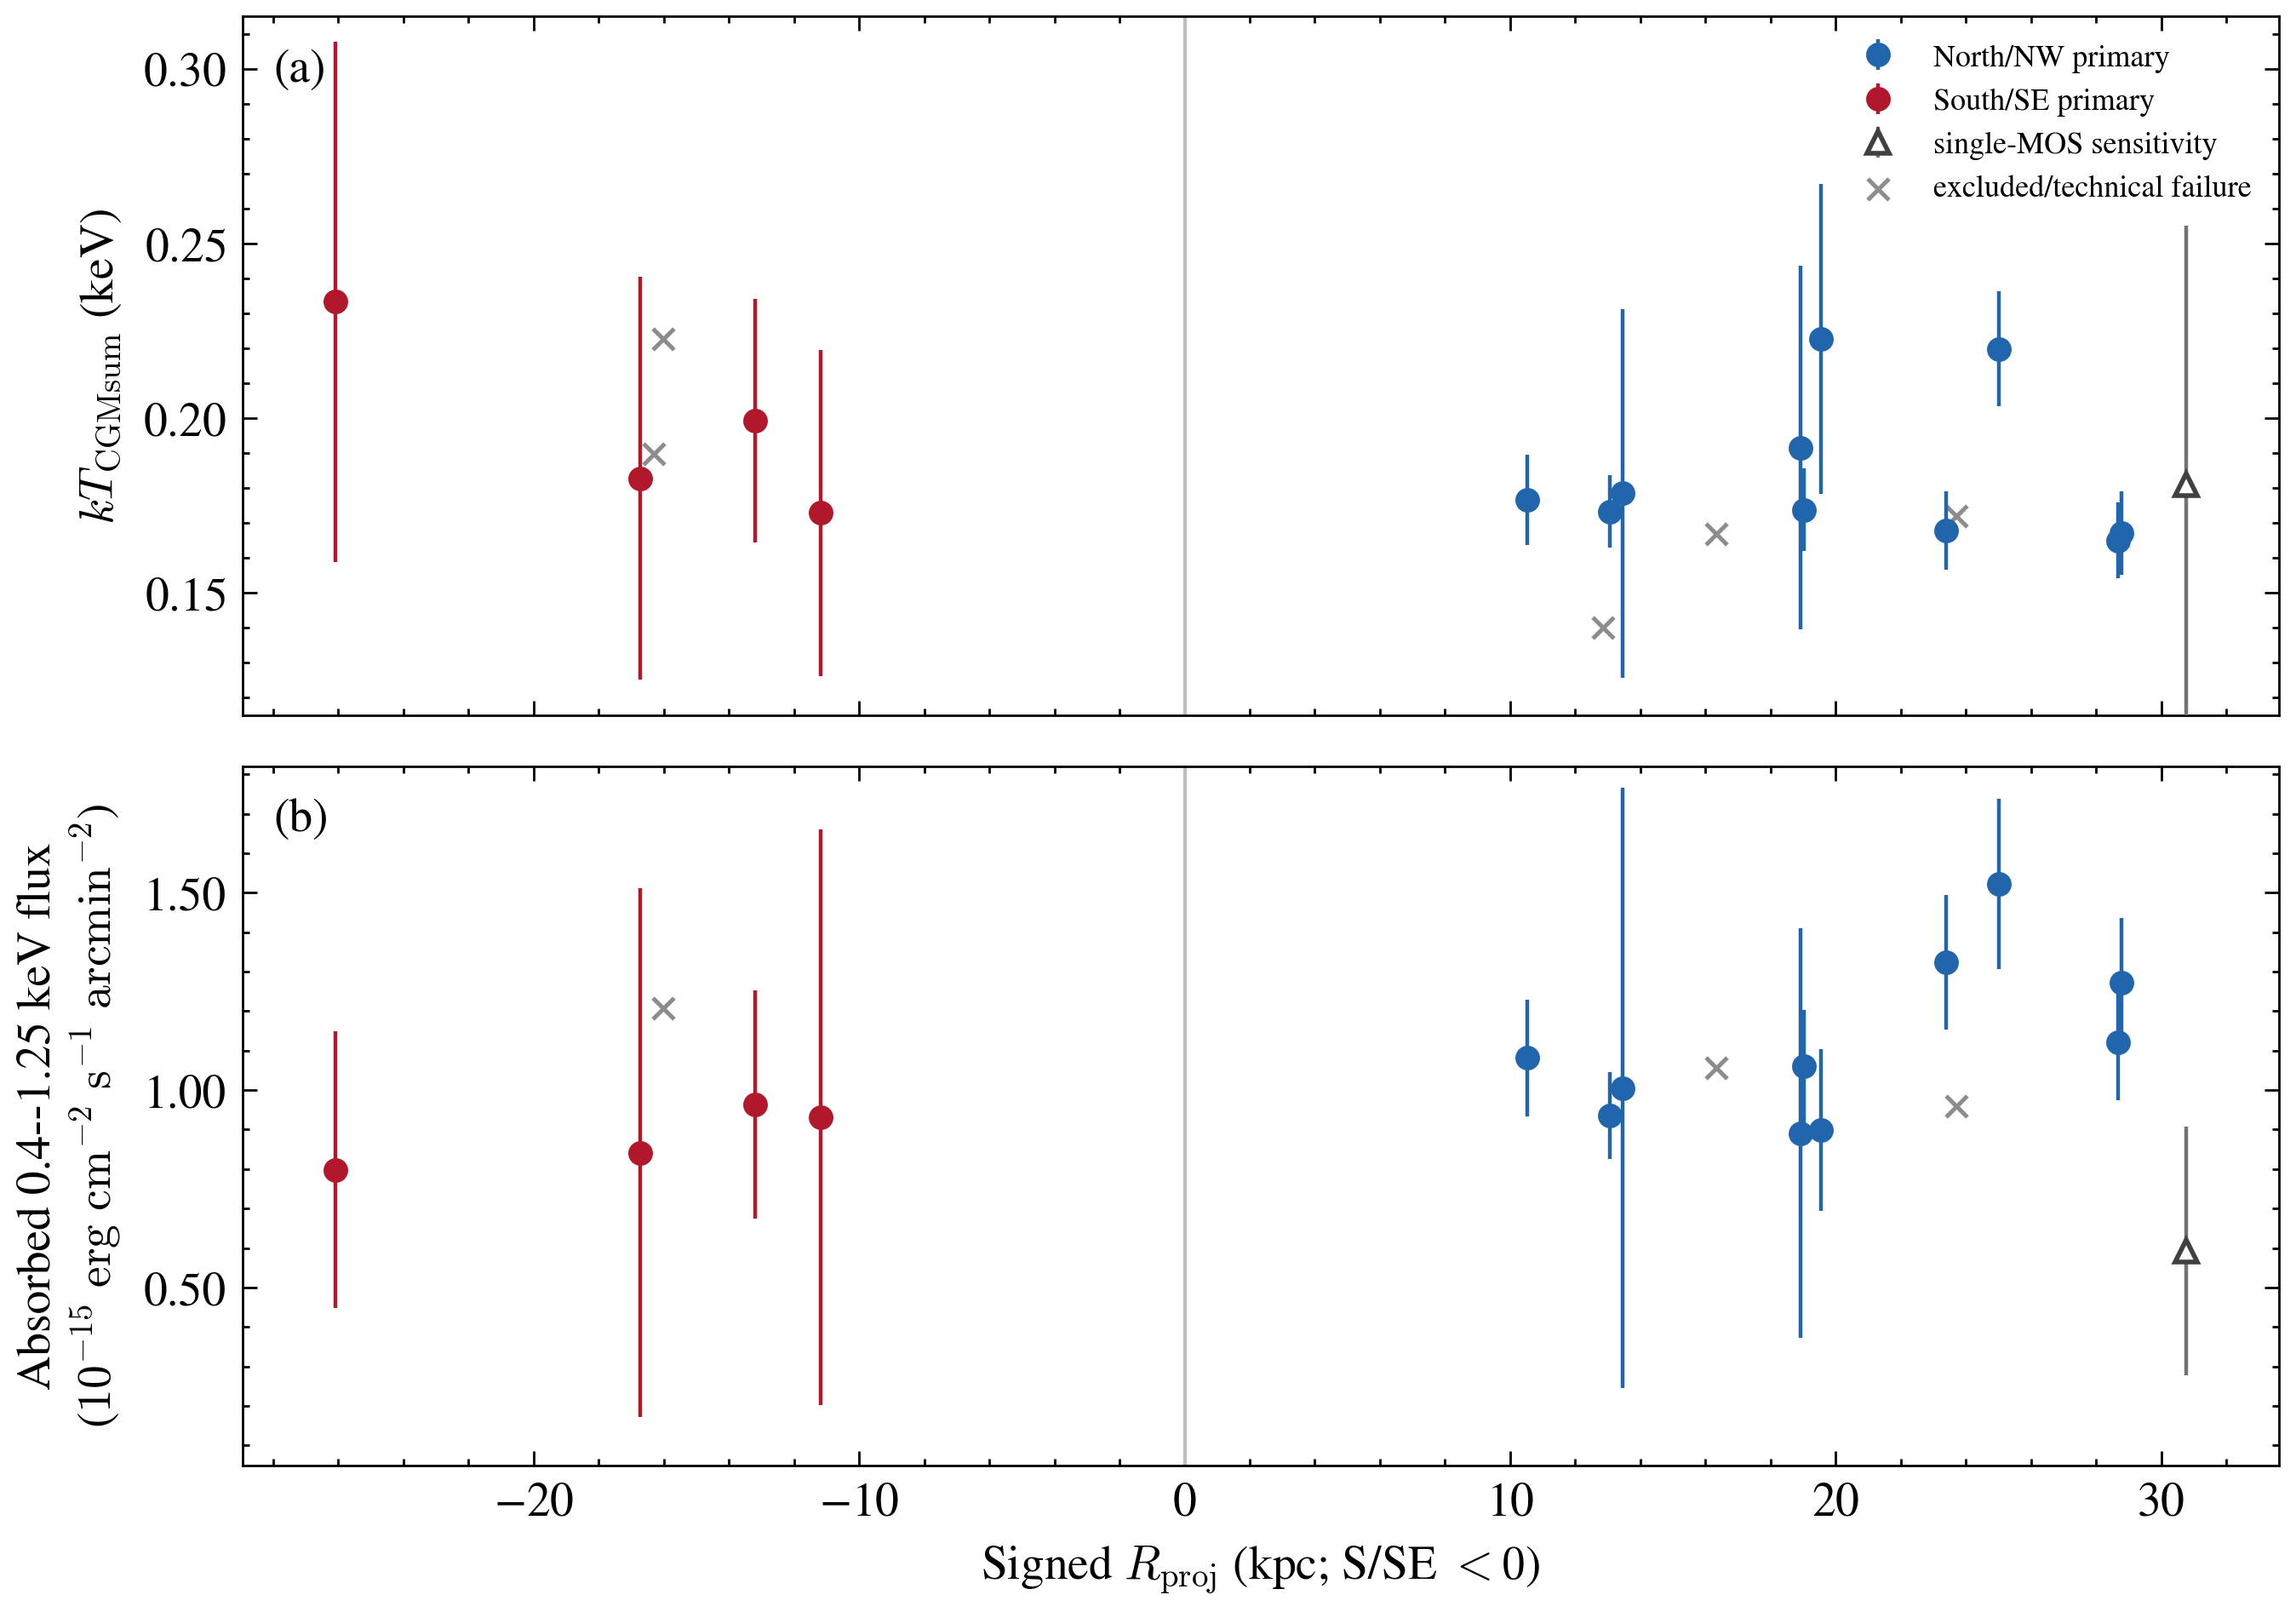
逐场看:温度一致,流量在北/西北与南/东南之间只有 \(1.01\sigma\) 的差别Field by Field: The Temperature Agrees, and the Flux Differs Between the Two Sides by Only \(1.01\sigma\)
11 / 1结果Results
讲稿SCRIPT
Here is the same information field by field, and this figure is worth reading carefully because it also shows the geometry problem. The top panel is the fitted temperature against signed projected radius, with the North and North-West side positive and the South and South-East side negative. You can see the temperature is flat across the whole sample. The bottom panel is the absorbed surface flux in the 0.4 to 1.25 keV band, which is the band that lies entirely inside the fitted soft interval. The North/NW best fit sits above the South/SE best fit, but the difference is 0.212 plus or minus 0.210, which is one sigma. That is consistency, not an asymmetry detection. Also look at the radial coverage: the two sides do not sample the same radii, and the South/SE fields have much larger error bars. So even this mild contrast is a descriptive result, not a final spatial constraint.
这是逐场的同一信息,这张图值得仔细看,因为它也显示了几何问题。上图是拟合温度对带符号投影半径,北和西北侧为正,南和东南侧为负。可以看到温度在整个样本上是平的。下图是 0.4 到 1.25 keV 能段的吸收面亮度,这个能段完全落在拟合的软区间内。北/西北的最佳拟合高于南/东南,但差值是 0.212 加减 0.210,只有一个 \(\sigma\)。这是一致性,不是不对称探测。还要看径向覆盖:两侧采样的半径不同,而且南/东南视场的误差棒大得多。所以即使这个温和的对比也只是描述性结果,不是最终的空间约束。
cumulative 16:30 / 45:00
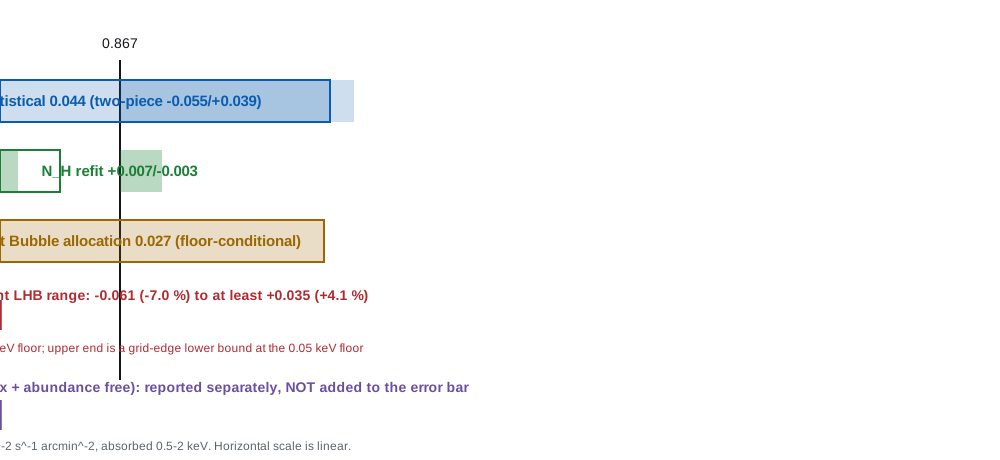
误差预算:统计误差主导,两个系统项都小,而模型敏感性单独报告The Error Budget: Statistics Dominate, Both Systematics Are Small, and the Model Sensitivity Is Reported Separately
13 / 1结果Results
讲稿SCRIPT
The error budget, drawn to scale. The statistical error, 0.044, dominates. The absorption refit term is tiny, plus 0.007 minus 0.003, and that is because the spectra do not actually constrain the column: if you let the column float, the fit sits at or below the HI4PI value and the likelihood is flat over about a factor of two. So the absorbed flux is insensitive to it, which is a statement about insensitivity, not a column measurement. The Local Hot Bubble allocation is plus or minus 0.027, and it depends on where we put the lower temperature bound of the bubble: at the 0.08 keV floor the full range runs from minus 0.061 to at least plus 0.035. Finally, the purple bracket. We also ran a model-sensitivity test in which the cosmic X-ray background photon index and the abundance are both free, and that gives 0.834. That is a three-point-nine percent shift, the model is not preferred by AIC, and we report it as a sensitivity rather than adding it to the error bar. I want to be explicit about that choice, because it is the kind of choice that is easy to make silently.
误差预算,按比例绘制。统计误差 0.044 占主导。吸收重新拟合项很小,+0.007/−0.003,这是因为光谱实际上并不约束柱密度:如果你让柱密度自由,拟合会落在 HI4PI 值或其下方,似然在约两倍范围内是平的。所以吸收通量对它不敏感,这是关于不敏感的陈述,不是柱密度测量。本地热气泡分配是 \(\pm 0.027\),它取决于我们把气泡温度下界放在哪里:在 0.08 keV 下界,完整范围从 −0.061 到至少 +0.035。最后,紫色括号。我们还跑了一个模型敏感性检验,让宇宙 X 射线背景光子指数和丰度都自由,得到 0.834。这是 3.9% 的移动,模型不被 AIC 偏好,我们把它作为敏感性报告,而不是加进误差棒。我想明确这个选择,因为这是一种容易被默默做出的选择。
A question I often get at this point is whether the error bar is honest. The honest answer is that the bar covers the statistical error and two named systematics, and that I have told you about three more that are not in it. That is not the same as saying the bar is complete. What I can say is that every term in it has a measured origin, and that the two largest open items have a job running to bound them.
讲到这儿我常被问到的一个问题是:这个误差棒诚实吗?诚实的回答是:它覆盖统计误差和两个具名系统项,而我已经告诉你有另外三个不在里面。这不等于说误差棒是完整的。我能说的是:里面每一项都有可测的来源,而且两个最大的未决项都有作业在跑以界定它们。
cumulative 20:30 / 45:00
既然不能分解,我们就把银河系前景模型当成假设来检验一致性Since We Cannot Decompose, We Test Published Milky Way Foreground Models as Hypotheses
做法:取一个具名的银河系模型,沿 14 个真实方向投影,转成同一能段,与测得的总和比较。Approach: take a named Milky Way model, project it through the 14 actual sightlines, convert it to the same band, and compare with the measured sum.
这不是距离分解,而是一个"这个前景模型是否与非负的 M31 残差相容"的检验。This is not a distance decomposition; it is a test of whether that foreground model is compatible with a non-negative M31 residual.
每个结论都带着所用前景先验的名字、能段转换和不确定性。Every conclusion carries the name of the foreground prior used, its band conversion and its uncertainty.
18 / 1讨论Discussion
讲稿SCRIPT
This brings me to the discussion, and to the only honest way to use the number for science. Since we cannot decompose, we turn the question around. Instead of asking what M31 is, we take a published Milky Way foreground model as a hypothesis, project it through our actual fourteen sightlines, convert it into the same energy band with the same abundance and absorption conventions, and ask whether it leaves room for a non-negative M31 residual. That is a consistency test, not a decomposition. And every number that comes out of it carries the name of the prior that produced it. I will show you five such models, and the interesting thing is that they do not agree with each other.
这把我带到讨论部分,也带到把这个数字用于科学的唯一诚实方式。既然不能分解,我们把问题反过来。不问 M31 是什么,而是把一个已发表的银河系前景模型当作假设,沿我们真实的十四条视线投影,用同样的丰度和吸收约定转换到同一能段,然后问它是否给非负的 M31 残差留出空间。这是一致性检验,不是分解。而且从它得到的每个数字都带着产生它的先验的名字。我给你看五个这样的模型,有趣的是它们彼此并不一致。
cumulative 27:30 / 45:00
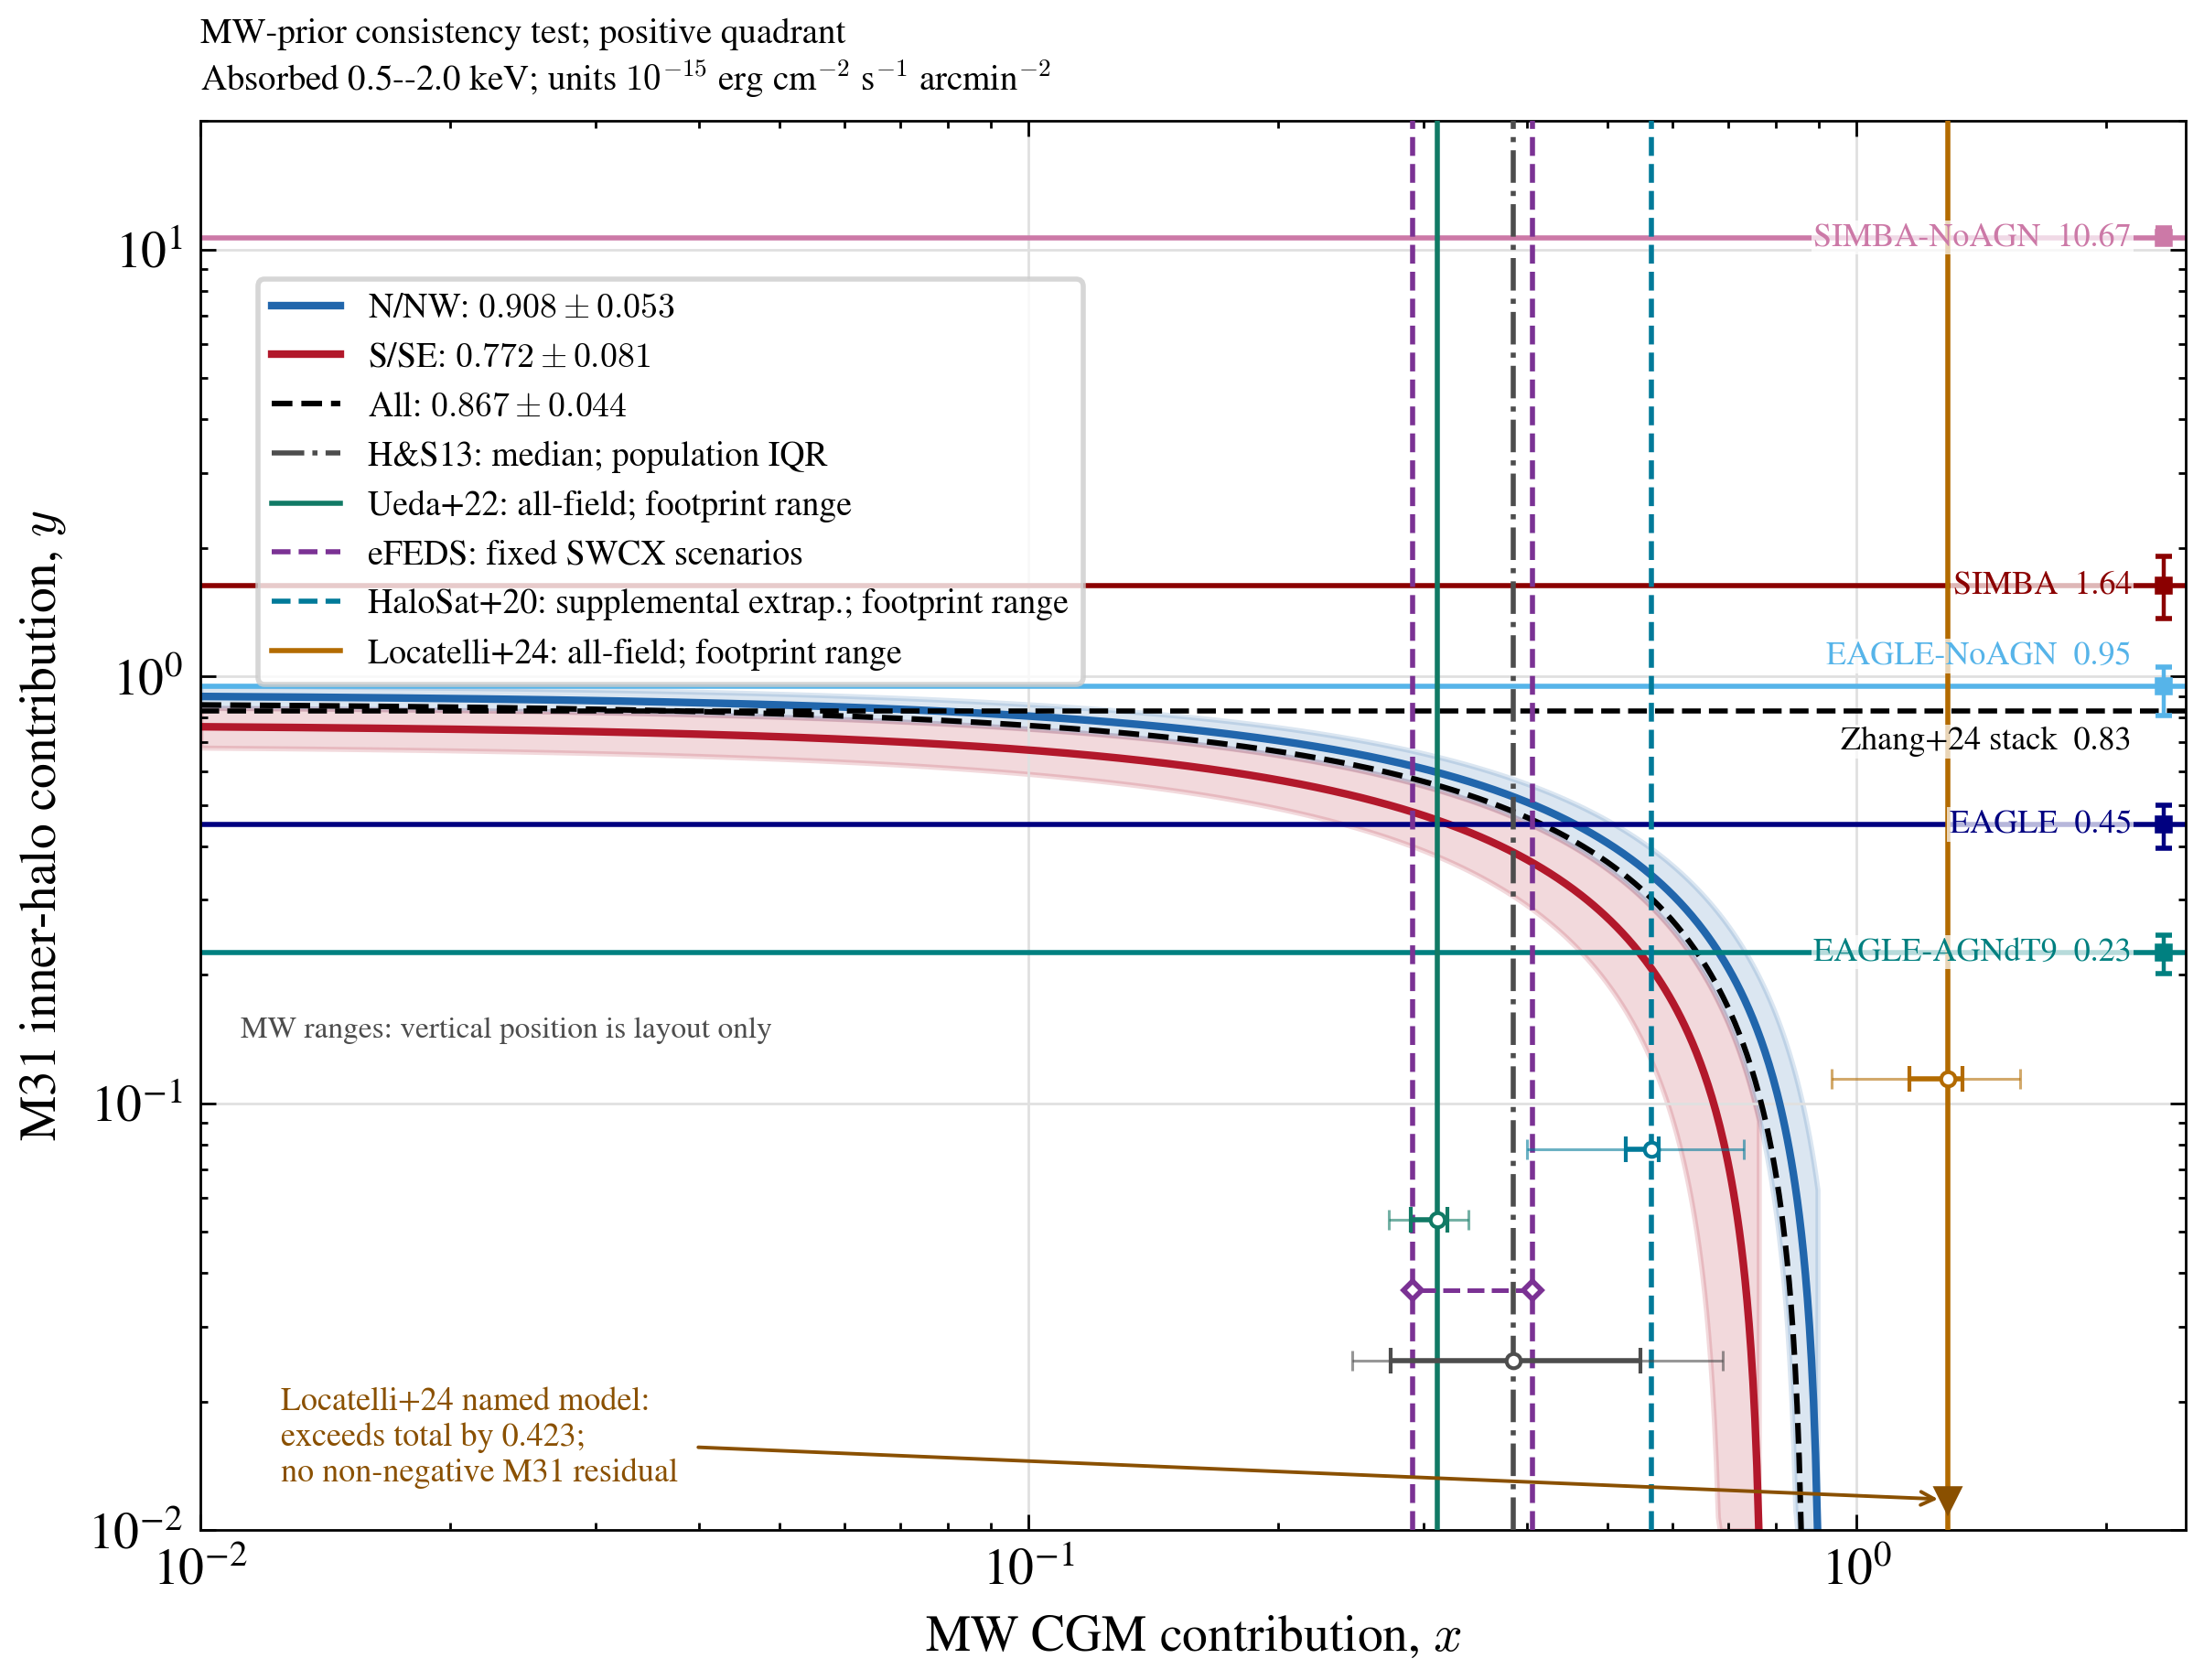
五个银河系研究中四个预测更低,所以冲突是那一个投影特有的Of Five Milky Way Studies Four Predict Less, so the Conflict Is Specific to That One Projection
19 / 1讨论Discussion
讲稿SCRIPT
Here is that test, on logarithmic axes so that zero and negative solutions are simply off the plot. The horizontal axis is the Milky Way component, the vertical axis is M31, and the diagonal bands are our sum constraints: everything on a band satisfies the measurement. The five vertical lines are five Milky Way predictions, all converted onto the same terms. The reference combined model of Locatelli and collaborators sits at 1.29, which is above our measured total of 0.867, so it leaves no non-negative M31 residual at all: the excess is 0.423. But look at the other four. The Suzaku disk projection toward the M31 footprint gives 0.31, a supplemental extrapolation of the HaloSat model gives 0.57, the two eFEDS scenarios give 0.29 and 0.41, and the high-latitude population median is 0.39. All four are below the total, and all four permit a positive M31 complement. So the conflict is not a generic property of Milky Way estimates. It is specific to that one projection, and to the chain of conversions that carries it from a narrow oxygen-line band to an absorbed broadband flux.
这就是那个检验,用对数坐标,这样零和负解就直接在图外。横轴是银河系分量,纵轴是 M31,斜带是我们的和约束:带上的每一点都满足测量。五条竖线是五个银河系预测,都转换到同样的约定。Locatelli 及其合作者的参考组合模型在 1.29,高于我们测得的总量 0.867,所以它完全没有留下非负的 M31 残差:超出 0.423。但看另外四个。朝向 M31 足迹的 Suzaku 盘投影给出 0.31,HaloSat 模型的一个补充性外推给出 0.57,两个 eFEDS 情景给出 0.29 和 0.41,高纬度星族中值是 0.39。四个都低于总量,四个都允许正的 M31 补量。所以这个冲突不是银河系估计的普遍性质。它特定于那一个投影,以及把它从窄氧线波段带到吸收宽带通量的那一串转换。
I want to add one caution about reading this figure, because it is the figure most likely to be screenshotted out of context. The five vertical lines are not five measurements of the same thing. They come from different instruments, different energy bands, different selections, and two of them are not local to M31 at all. What they have in common is only that each was converted onto our terms. So the correct reading is not "four studies agree and one is wrong"; it is "the spread among published Milky Way predictions is larger than our measurement error, which is why a decomposition needs a named prior".
关于读这张图我要加一句提醒,因为它最可能被截屏脱离上下文。五条竖线不是对同一件事的五次测量。它们来自不同仪器、不同能段、不同选择,其中两个根本不在 M31 附近。它们唯一共同点是每一个都转换到了我们的约定上。所以正确的读法不是"四个研究一致、一个错了";而是"已发表银河系预测之间的散布比我们的测量误差还大,这就是为什么分解需要一个具名先验"。
cumulative 28:30 / 45:00
对做弥漫 X 射线的人:先量"和",再谈分解,并且把阈值校准写进计划For Anyone Doing Diffuse X-Ray Work: Measure the Sum First, Decompose Later, and Budget for Threshold Calibration
1. 同温度的成分无法用 EPIC 光谱分开;先报视线和及其空间对比。1. Components at the same temperature cannot be separated by an EPIC spectrum; report the line-of-sight sum and its spatial contrast first.
2. 非负成分的单侧上限必须用模拟校准阈值,不能靠 F 检验。2. One-sided limits on a non-negative component need a simulation-calibrated threshold, not an F-test.
3. 外部模型先验要带名字、能段转换和不确定性一起报。3. External model priors must be reported with their name, band conversion and uncertainty attached.
21 / 1意义Implications
讲稿SCRIPT
What does this mean for other people doing diffuse X-ray work? Three practical lessons, and they are the ones I would want if I were starting. First, if two of your components sit at the same temperature, your spectrum cannot separate them, so report the sum and its spatial contrast as your primary result, and treat any decomposition as a conditional scenario with a named prior. Second, if you quote a one-sided upper limit on a component that is bounded below at zero, calibrate the threshold with simulations; the naive F-test threshold is not valid at that boundary, and we have a running calibration job precisely because of this. Third, whenever you borrow an external model, carry its name, its band conversion and its uncertainty with the number, because in our case the spread between five published Milky Way predictions is larger than our measurement error.
这对其他做弥漫 X 射线工作的人意味着什么?三条实用教训,如果我刚开始,我也会想要这三条。第一,如果你的两个成分温度相同,你的光谱无法分开它们,所以把和及其空间对比作为主要结果报出来,并把任何分解当作带具名先验的条件情景。第二,如果你要报一个在零处有下界的成分的单侧上限,用模拟校准阈值;朴素的 F 检验阈值在那个边界附近无效,而我们正有一个校准作业在跑,正是因为这个原因。第三,每当你借用外部模型,把它的名字、能段转换和不确定性跟着数字一起带上,因为在我们的例子里,五个已发表银河系预测之间的散布比我们的测量误差还大。
If I had to compress the three lessons into one sentence for a methods paper, it would be this: report what the instrument actually constrains, name the assumption behind every number that goes further, and pre-register the decision rule before you read the result. All three are cheap to do at the start and expensive to retrofit.
如果要把三条教训压缩成方法论文里的一句话,那就是:报告仪器真正约束的东西;给每一个走得更远的数字标明背后的假设;在读结果之前预先登记决定规则。这三件事在开始时做都很便宜,事后补做都很贵。
cumulative 32:30 / 45:00
接下来:用匹配年代的外场做历元检验,并完成上限阈值的模拟校准Next: An Epoch Test on Matched Outer Fields, and Completion of the Threshold Calibration
历元检验:外场流量随观测年代下降(早/晚对比,步变优于连续趋势,\(\Delta \mathrm{AIC}\) 约 9.5),原因未定——可能是仪器/流水线,也可能是太阳风电荷交换。Epoch test: the outer-field flux falls with observation epoch (an early/late contrast; a step fits better than a continuous trend, \(\Delta \mathrm{AIC}\) about 9.5), and the cause is unresolved — instrument or pipeline, or solar-wind charge exchange.
检验规则已预先登记(配对、边界、判定与"无法判定"出口),等外场批次跑完再拟合。The test rule is pre-registered (pairing, boundary, outcomes and an infeasible exit) and the fits wait for the outer-field batch to finish.
22 / 1下一步Next steps
讲稿SCRIPT
What is next. The most important open question is not about M31 at all: it is whether our outer comparison fields are trustworthy. In the archival outer sample, the measured flux falls with observation year, and on the current sample a step fits better than a continuous trend. The cause is unresolved. It could be an instrument or pipeline change, it could be solar-wind charge exchange, and we cannot tell them apart with the data we have. So we are re-extracting a batch of outer fields homogeneously and running a pre-registered early-versus-late test on matched pairs, with the rule, including an infeasible outcome, fixed before any fit. That batch is still running and the result is pending. Separately, the threshold calibration for the upper limits is running, and until it finishes every limit I quoted keeps the words "threshold uncalibrated".
下一步是什么。最重要的开放问题根本不关于 M31:它是我们的外场比较是否可信。在档案外场样本中,测得的流量随观测年代下降,而在当前样本上,步变比连续趋势拟合得更好。原因未定。可能是仪器或流水线变更,也可能是太阳风电荷交换,用现有数据无法区分。因此我们正在同质地重新抽取一批外场,并在匹配配对上运行一个预先登记的早/晚检验,规则——包括"无法判定"这一出口——在任何拟合之前就已固定。该批次仍在运行,结果待定。另外,上限的阈值校准正在运行,在它完成之前,我报的每个上限都带着"阈值未校准"这几个字。
cumulative 36:00 / 45:00
(可跳过)侧面几何:两侧不是匹配的环,所以 mild 对比只是描述(Skippable) Side Geometry: The Two Sides Are Not a Matched Annulus, so the Mild Contrast Is Only Descriptive
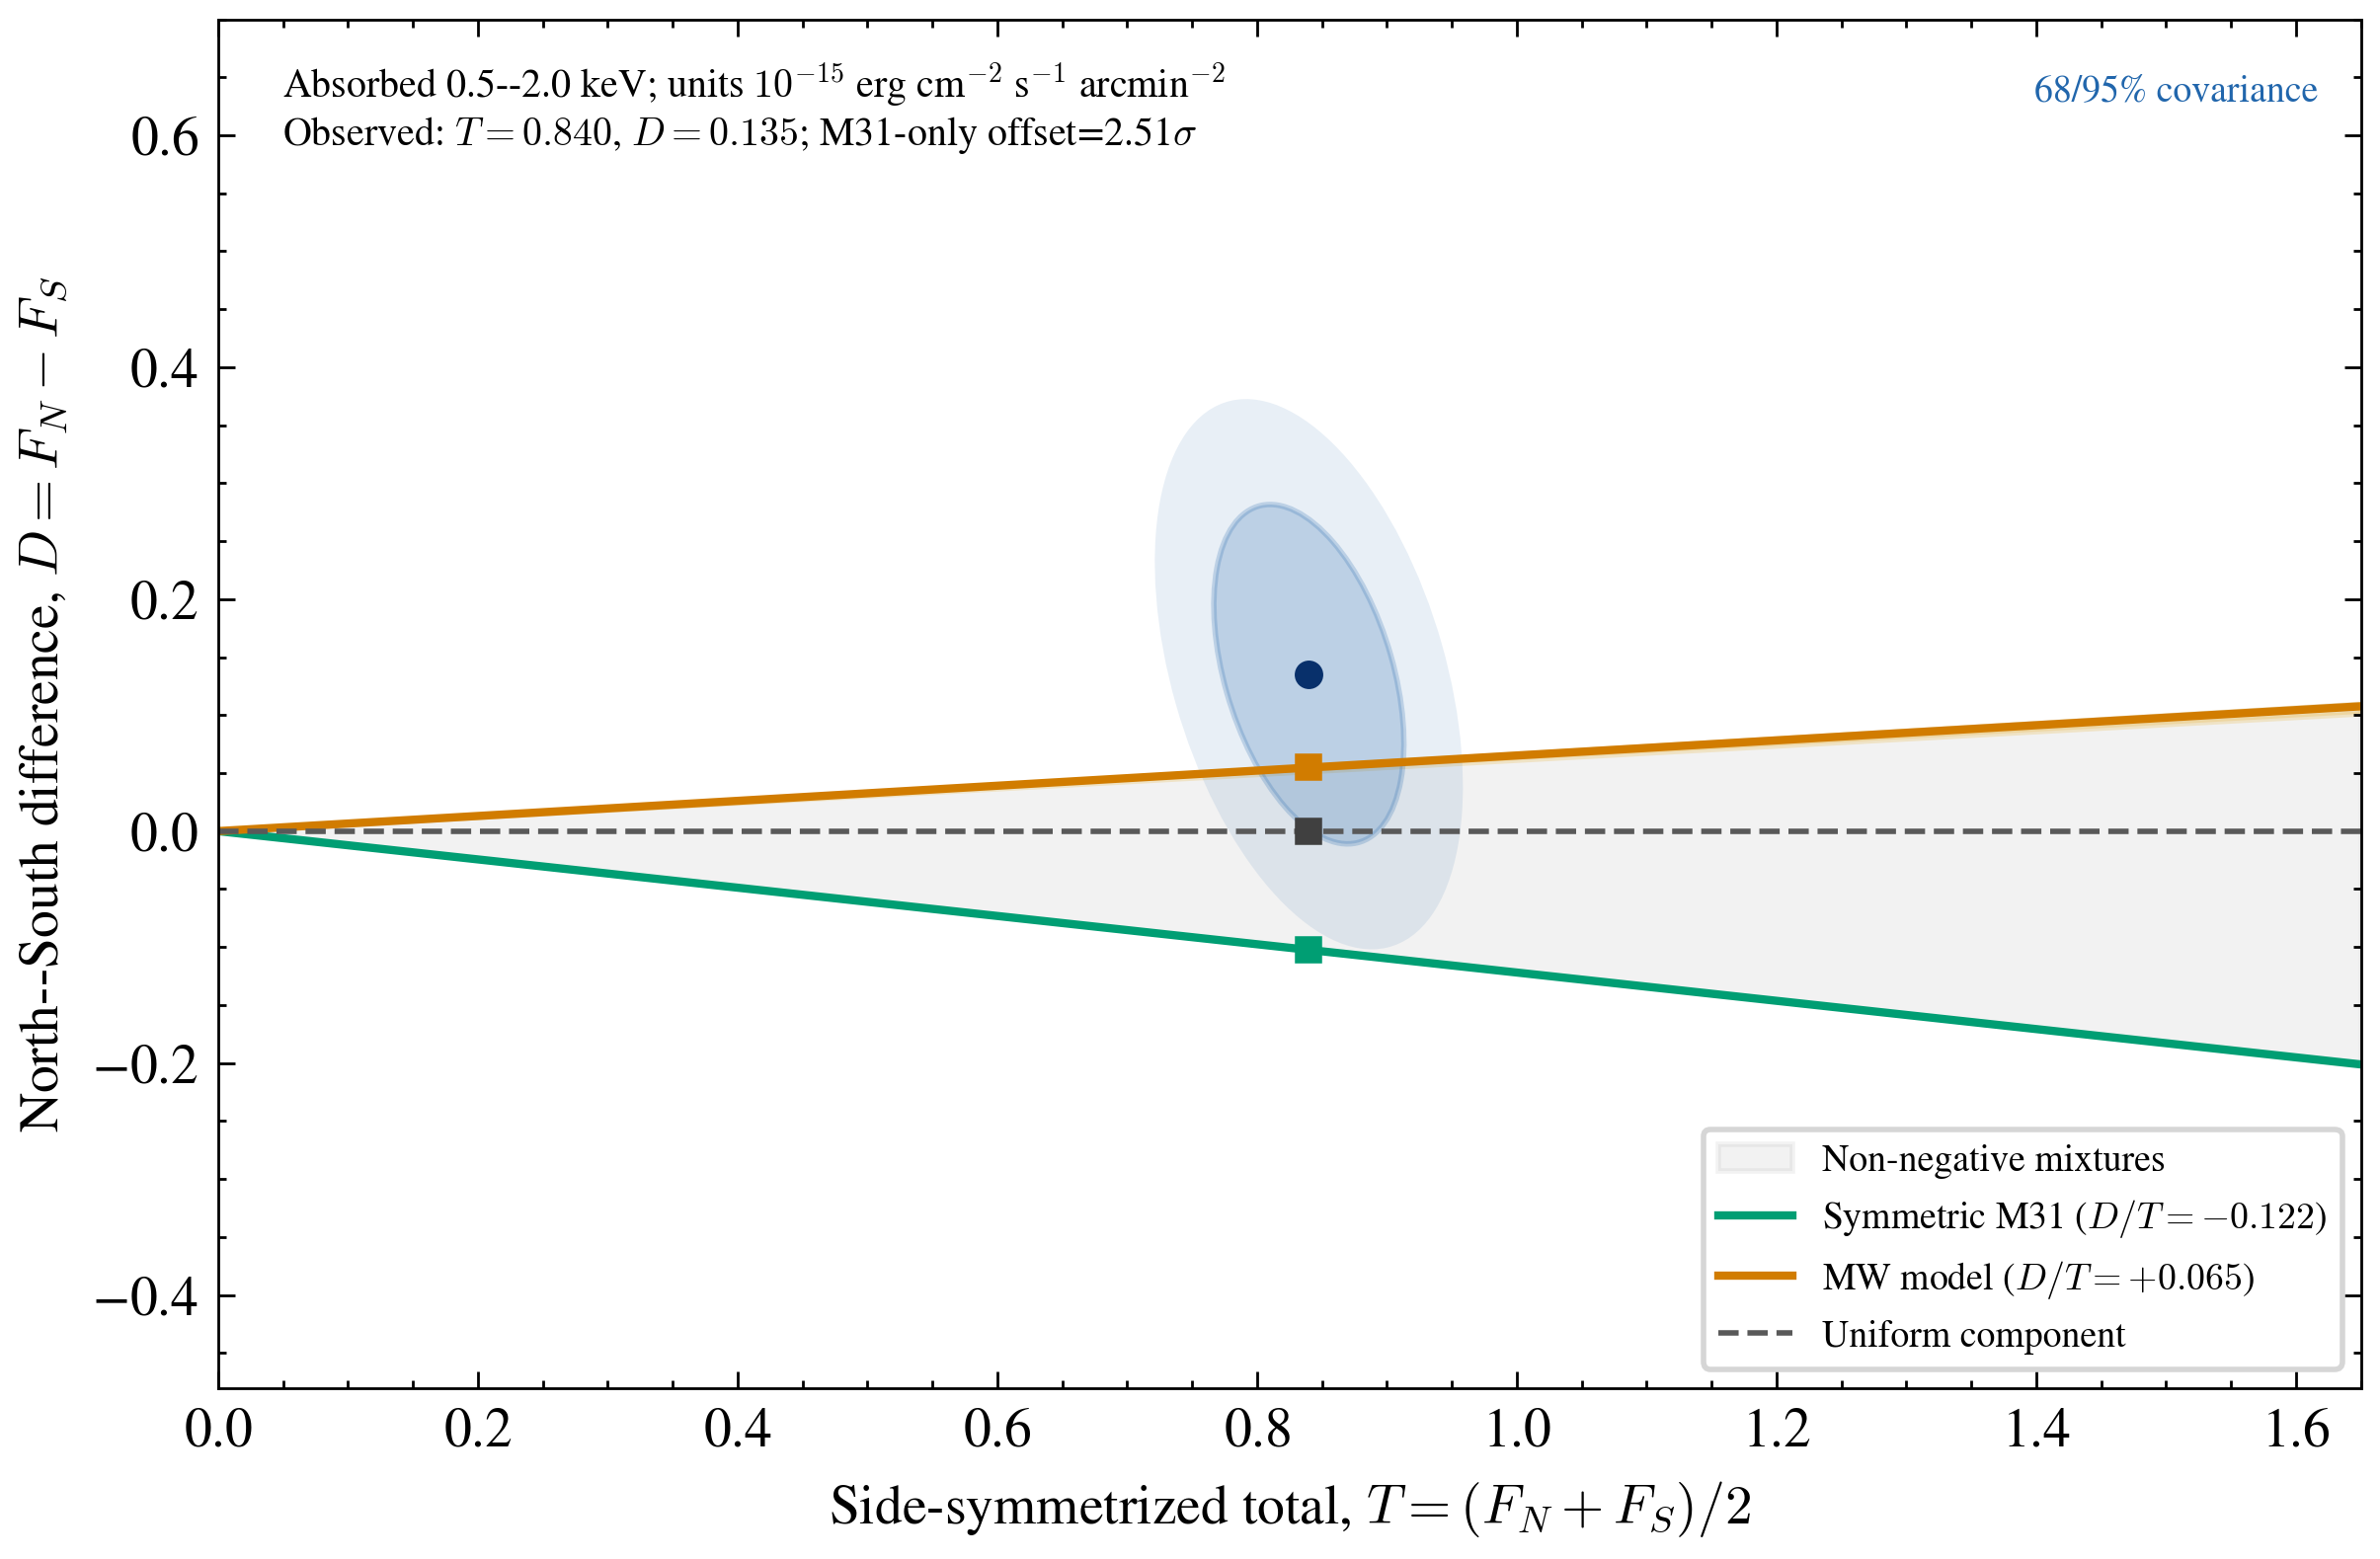
观测 D = +0.135,T = 0.840(在重新加权的基线上)。Observed D = +0.135 and T = 0.840 on the reweighted basis.
符号更兼容银河系纬度梯度,但三种模板的残差分别只有 \(0.82\sigma\)、\(1.40\sigma\)、\(2.51\sigma\),没有一个被有用地排除。The sign is more compatible with a Milky Way latitude gradient, but the residuals for the three templates are only \(0.82\sigma\), \(1.40\sigma\) and \(2.51\sigma\), so none is excluded at a useful significance.
24 / 1可选Optional可跳过 · disposableSkippable · disposable
讲稿SCRIPT
This slide is disposable: if we are short of time, skip it and go to the caveats. It is the geometry diagnostic. We form a side-symmetrised total and a North-minus-South difference, and plot them against the predictions of three spatial templates. The observed difference is positive and small. The sign is more compatible with a Milky Way latitude gradient than with a symmetric M31 profile, because the North fields lie closer to the Galactic plane. But when you propagate the covariance properly, the residuals are 0.82 sigma for the Milky Way template, 1.4 for a uniform component, and 2.5 for the symmetric M31 template. So this is a weak sign discriminator at best, and it excludes nothing usefully. I include it because it is the kind of figure that gets over-read, and I would rather show you the number than the adjective.
这张幻灯片是可抛弃的:如果时间不够,跳过它,直接去保留意见。这是几何诊断。我们构造一个两侧对称化的总量和一个北减南差,并把它们与三个空间模板的预测画在一起。观测差值是正的且很小。符号与银河系纬度梯度比与对称 M31 轮廓更相容,因为北侧视场更靠近银河系平面。但当你正确传播协方差后,三个模板的残差分别是:银河系模板 0.82 \(0.82\sigma\)、均匀成分 1.4 \(1.4\sigma\)、对称 M31 模板 2.5 \(2.5\sigma\)。所以这至多是一个弱的符号判别器,它没有有用地排除任何东西。我放这张图,是因为这类图容易被过度解读,我宁愿给你看数字而不是形容词。
cumulative 40:00 / 45:00
(可跳过)样本账目:22 → 20 → 18 → 15 → 14,每一步都可复现(Skippable) Sample Accounting: 22 → 20 → 18 → 15 → 14, Every Step Reproducible
22 个选定指向 → 20 个可恢复拟合会话 → 18 个通过完整技术校验 → 15 个数值有效(含 MOS2-only 的 0800730101)→ 14 个双 MOS 主场。22 selected pointings → 20 restorable fitting sessions → 18 passing full technical validation → 15 numerically valid (including the MOS2-only 0800730101) → 14 dual-MOS primaries.
排除原因:两个会话自由度非正,两个拟合未收敛,三个不满足 p_fit \(\geq 0.01\)。Exclusion reasons: two sessions with non-positive degrees of freedom, two unconverged fits, three failing p_fit \(\geq 0.01\).
主场 10 北/西北 + 4 南/东南;严格敏感样本 12 场。The primary sample is 10 North/NW + 4 South/SE; the strict sensitivity sample is 12 fields.
25 / 1可选Optional可跳过 · disposableSkippable · disposable
讲稿SCRIPT
Also skippable. This is the sample accounting, in case someone wants to audit the selection. All 22 pointings were attempted. Twenty produced restorable sessions, and all twenty passed an independent restore test in a separate validation environment. Eighteen passed the complete technical gate. Two of those have non-positive final degrees of freedom and are counted as technical failures, two more did not converge, and three fail the numerical quality criterion. That leaves fifteen numerically valid fields, of which one has only MOS2 and is therefore outside the primary sample, giving fourteen. The point of showing this is that every step has a machine-readable reason, and none of the rules looks at the fitted flux.
这张也可跳过。这是样本账目,以防有人想审计选择。全部 22 个指向都尝试了。20 个产生可恢复会话,全部 20 个在独立的校验环境中通过恢复测试。18 个通过完整技术门槛。其中两个最终自由度非正,计为技术失败,另两个未收敛,三个不满足数值质量判据。剩下 15 个数值有效视场,其中一个只有 MOS2,因此在主样本之外,得到 14 个。展示这一点的意义在于每一步都有机器可读的原因,而且没有一条规则看拟合流量。
cumulative 41:30 / 45:00
(可跳过)已撤回的说法:这些数字曾经出现过,现在不再是结论(Skippable) Withdrawn Statements: These Numbers Once Appeared and Are No Longer Conclusions
0.965 作为当前总量 —— 已被 0.867 取代(单起点局部协方差回归值)。0.965 as the current total — superseded by 0.867 (a single-start local-covariance regression value).
"纯气体 0.82"作为总量 —— 已撤回;没有分解之前不报纯气体数字。"Gas-only 0.82" as the total — withdrawn; no gas-only number is quoted before a decomposition exists.
大核(r_c 50–200 kpc)上限 —— 年代混淆,加历元项后上限升高数倍,不得引用。Large-core (r_c 50–200 kpc) limits — epoch-confounded; with an epoch term the limits rise several-fold and must not be quoted.
"连续下降"与 min-p 0.14 —— 已撤回;正确措辞是早/晚对比,min-p 0.018(clean-13)。"Continuous decline" and min-p 0.14 — withdrawn; the correct wording is an early/late contrast, min-p 0.018 (clean-13).
26 / 1可选Optional可跳过 · disposableSkippable · disposable
讲稿SCRIPT
Third skippable slide, and I include it deliberately, because in a project that has been running this long some numbers have been withdrawn and it is useful to say which. The value 0.965 was our total for a while; it came from a single-start fit with local covariance errors and it is now superseded by 0.867, which uses profile-likelihood intervals and multistart. A gas-only value of 0.82 was quoted once and has been withdrawn. Limits on a large-core halo were computed from outer fields and turned out to be epoch-confounded: adding an epoch term raises them several-fold, so they must not be quoted. And the epoch effect itself was once described as a continuous decline with a minimum p-value of 0.14; that p-value came from a permutation that shuffled the fluxes but not their errors, and the correct value is 0.018 with an early-versus-late contrast as the right description. I mention these because if you have seen an earlier version of this talk, this is what changed.
第三张可跳过的幻灯片,我是有意放的,因为一个跑了这么久的项目里有些数字已被撤回,说明是哪些是有用的。0.965 曾经是我们的总量;它来自单起点拟合加局部协方差误差,现在被 0.867 取代,后者用轮廓似然区间和多重起点。纯气体值 0.82 曾经被报过,现已撤回。大核晕的上限是从外场算的,后来发现年代混淆:加历元项后上限升高数倍,因此不得引用。历元效应本身曾被描述为连续下降、最小 p 值 0.14;那个 p 值来自一个打乱了流量却没打乱误差的置换检验,正确值是 0.018,且正确的描述是早/晚对比。我提这些,是因为如果你看过早期版本的这个报告,这就是变化所在。
cumulative 43:00 / 45:00
备用 B1:pn 边角粒子背景未通过同等校验,这是产品成熟度问题Backup B1: The pn Corner Particle Background Has Not Passed an Equivalent Validation — a Product-Readiness Issue
22 个视场都有 pn 源谱;只有 21 个在同一事件选择与处理分支有匹配的 QPB 谱。All 22 fields have a pn source spectrum; only 21 have a matched QPB spectrum within the same event-selection and processing branch.
22 个中有 17 个清洗后曝光短于 10 ks——正是 ESAS 指出边角统计差、out-of-time 事件与软质子污染风险最大的 regime。17 of 22 cleaned pn exposures are shorter than 10 ks — the regime where ESAS identifies poor corner statistics, out-of-time events and enhanced soft-proton sensitivity.
因此推断的 pn QPB 可能被低估或高估,包括过度相减。这不是光学漏光主张,也不是对 EPIC-pn 的一般拒绝。The inferred pn QPB can therefore be under- or over-estimated, including oversubtraction. This is not an optical-light-leak claim and not a general rejection of EPIC-pn.
B1 / 1备用Backup
讲稿SCRIPT
Backup B1, for the pn question. The numbers are on the slide. The one nuance worth saying out loud is that the QPB for pn is normalised from a small out-of-field corner region, and in short exposures that region has poor statistics and is contaminated by out-of-time events. So the inferred particle background carries a bias risk that we have not bounded across the sample. Adding pn now would add data and add an uncontrolled systematic at the same time.
备用 B1,回答 pn 问题。数字都在幻灯片上。值得说出口的一个细微之处是:pn 的 QPB 是从一个很小的视场外边角区域归一化的,在短曝光中该区域统计很差且被 out-of-time 事件污染。所以我们推断的粒子背景带有我们尚未在整个样本上界定的偏差风险。现在加 pn 会同时增加数据和一个不受控的系统项。
备用(不计时)backup (not timed)
备用 B2:能段转换是 kT 依赖的,所以每个分量按自己的温度转换Backup B2: The Band Conversion Depends on kT, so Each Component Is Converted at Its Own Temperature
0.4–1.25 与 0.5–2.0 keV 的比值在测试的参数网格上是 1.10–1.15,不是常数。The ratio between the 0.4–1.25 and 0.5–2.0 keV bands is 1.10–1.15 across the tested parameter grid, not a constant.
我们的冷成分(0.175 keV)乘约 1.14;Locatelli 参考成分(0.15 keV)乘约 1.18。Our cool component (0.175 keV) is multiplied by about 1.14; the Locatelli reference component (0.15 keV) by about 1.18.
因此 Figure-3 式的比较必须把每一侧在它自己的温度上转换,不能用一个通用标度。A Figure-3-style comparison must therefore convert each side at its own temperature, not with one universal scale factor.
B2 / 1备用Backup
讲稿SCRIPT
Backup B2, on conversions. This is the kind of detail that decides whether a literature comparison is honest. The ratio between our primary band and the comparison band is temperature dependent, so we convert each component at its own temperature. The practical consequence is about a four percent difference in how the two sides of the comparison are scaled, which is small but not zero, and it is the reason we do not simply rescale an old band mean.
备用 B2,关于转换。这是决定文献比较是否诚实的细节。我们的主能段与比较能段之间的比值依赖温度,所以每个成分按自己的温度转换。实际后果是比较两侧的标定相差约百分之四,虽小但不是零,这也是我们为什么不简单地把旧能段均值重新标定。
备用(不计时)backup (not timed)
备用 B3:未分解源是已命名系统项,其归因仍未定Backup B3: Unresolved Sources Are a Named Systematic and Their Attribution Is Still Open
掩模覆盖了 Paper I 中 99.4 % 的在探测器内的 > 1e-14 源;14 个主场中有 11 个未掩模源,约 +0.05 的偏差。The mask covers 99.4 % of on-detector Paper I sources above 1e-14; 11 unmasked sources in the 14 primary fields give about a +0.05 bias.
PSF 翅膀泄漏的经验值约 10 \(\pm\) 9 %(1.2\(\sigma\)),一个可用流量道上的 King 标定混合。The empirical PSF-wing leak is about 10 \(\pm\) 9 %, a King-scaled hybrid on one usable flux bin.
总预算 0.12–0.33 的成分比例;放开 CXB 指数减小的流量空间上是平的,未归因于 M31 X 射线双星,也未确立为 AGN 模仿。Total budget 0.12–0.33 of the component fraction; the flux removed by freeing the CXB index is spatially flat, not attributed to M31 X-ray binaries and not established as an AGN mimic.
B3 / 1备用Backup
讲稿SCRIPT
Backup B3, on unresolved sources. Two separate effects. The mask leaves a small residual bias, about five percent, from eleven unmasked bright sources. And the point-spread-function wings of masked sources leak into the aperture, empirically about ten plus or minus nine percent on the one flux bin where we could measure it. Both are in the named systematic budget. The honest summary is that the plausible contamination is a tenth to a third of the component, and that this is not a ceiling.
备用 B3,关于未分解源。两个分开的效应。掩模留下一个小的残余偏差,约百分之五,来自 11 个未掩模的亮源。而被掩模源的点扩散函数翅膀会漏进孔径,在唯一可测的流量道上经验值约 10% 加减 9%。两者都在具名系统预算里。诚实的总结是:合理污染是成分的十分之一到三分之一,而且这不是上限。
备用(不计时)backup (not timed)
备用 B4:一个温度够用,但"够用"不等于"只有一个物理成分"Backup B4: One Temperature Is Adequate, but "Adequate" Is Not "Only One Physical Component"
共享温度检验:\(\Delta \mathrm{stat} = 11.2\)(13 个自由度)支持一个共同温度。Shared-temperature test: \(\Delta \mathrm{stat} = 11.2\) on 13 degrees of freedom supports one common temperature.
加第二个热成分只改善统计量 \(\leq 0.24\)(13 个自由度)。Adding a second thermal component improves the statistic by at most 0.24 on 13 degrees of freedom.
丰度是一个流量杠杆:0.1 或 1.0 的 Z 让 6 场总量移动 −6 % / −9 %,单场最多 −31 %。Abundance is a flux lever: Z of 0.1 or 1.0 moves the 6-field total by −6 % / −9 %, and a single field by up to −31 %.
B4 / 1备用Backup
讲稿SCRIPT
Backup B4. The statistical statement is that one temperature is adequate and a second thermal component buys nothing. But I want to flag the abundance lever, because it is the one model assumption that moves the flux: fixing the abundance at 0.3 solar is a choice, and moving it to 0.1 or 1.0 shifts a six-field total by six to nine percent. That is why the combined sensitivity test, in which the abundance and the background photon index are both free, is reported even though it is not added to the error bar.
备用 B4。统计陈述是:一个温度足够,加第二个热成分没有收益。但我想指出丰度这个杠杆,因为它是唯一会移动流量的模型假设:把丰度固定在 0.3 太阳是一个选择,把它移到 0.1 或 1.0 会让六场总量移动 6% 到 9%。这就是为什么那个组合敏感性检验——让丰度和背景光子指数都自由——会被报告,即使它不加进误差棒。
备用(不计时)backup (not timed)
备用 B5:上限阈值未校准,覆盖度检验正在跑(待定)Backup B5: The Upper-Limit Threshold Is Uncalibrated; the Coverage Test Is Running (Pending)
集中晕上限用插值的 \(\Delta \mathrm{stat} = 2.71\);玩具模拟的覆盖度取决于抽样族:高斯抽样 0.87–0.88,反射似然位置族 0.975–0.984。The concentrated-halo limits use an interpolated \(\Delta \mathrm{stat} = 2.71\); toy-Monte-Carlo coverage depends on the sampling family: 0.87–0.88 for a Gaussian sampler, 0.975–0.984 for a reflected-likelihood location family.
曲线的非对称性违反高斯模型,所以必须校准,不能假定阈值。The curve's asymmetry violates the Gaussian model, so calibration is required and the threshold cannot be assumed.
校准作业在跑,预计还需数周;其覆盖度数字待定,读出规则已预先登记。The calibration job is running and needs several more weeks; its coverage number is pending, and the reading rule is pre-registered.
B5 / 1备用Backup
讲稿SCRIPT
Backup B5, on the calibration. This is the most technically honest slide in the deck. We used a standard threshold for a profile-likelihood upper limit, and then we tested it with toy simulations and found that the achieved coverage depends on how you draw the toy truths, because the profile curve is asymmetric and a Gaussian sampler is the wrong model for it. So the threshold is not yet known to be right. A production calibration is running, and the reading rule for its result was fixed before any coverage number existed. Until it lands, every limit in this talk carries the words "threshold uncalibrated", and I would rather say that than quote a number I cannot defend.
备用 B5,关于校准。这是全套幻灯片里技术上最诚实的一张。我们用了一个轮廓似然上限的标准阈值,然后用玩具模拟检验,发现达到的覆盖度取决于你如何抽取玩具真值,因为轮廓曲线是非对称的,高斯抽样是错的模型。所以这个阈值还不知道是否正确。一次生产级校准正在运行,其结果读出规则在任何覆盖度数字存在之前就已固定。在它出来之前,本报告每个上限都带着"阈值未校准"几个字,我宁愿这样说,也不报一个我无法辩护的数字。
备用(不计时)backup (not timed)
备用 B6:外场样本与观测年代混淆,所以"外场更暗"目前是 QuestionedBackup B6: The Outer Sample Is Confounded with Observation Epoch, so "Fainter Outer Fields" Is Currently Questioned
外场(8 个,82–253 kpc)v19 吸收流量 0.842 \(\pm\) 0.065,内场 0.965 \(\pm\) 0.044(同一估计量的比较;可引用总量是 0.867)。The 8 outer fields (82–253 kpc) give a v19 absorbed flux of 0.842 \(\pm\) 0.065 against 0.965 \(\pm\) 0.044 inside (a same-estimator comparison; the quotable total is 0.867).
但外场流量与年份相关(\(\rho -0.85\),p 0.0004):\(\leq 2009\) 为 1.05 \(\pm\) 0.08,\(\geq 2010\)(n = 3)为 0.55 \(\pm\) 0.09;内场全部在 2017–2018。But the outer flux correlates with year (\(r_{\rho} = -0.85\), p 0.0004): \(\leq 2009\) gives 1.05 \(\pm\) 0.08, and \(\geq 2010\) (n = 3) gives 0.55 \(\pm\) 0.09, while all inner fields are 2017–2018.
年代匹配后本征比值 0.54 \(\pm\) 0.16(未匹配 0.80 \(\pm\) 0.13)。原因未定:不是太阳周期 SWCX,仪器/流水线或选择效应仍可能。The epoch-matched intrinsic ratio is 0.54 \(\pm\) 0.16 (unmatched 0.80 \(\pm\) 0.13). The cause is unresolved: not solar-cycle SWCX, but instrument, pipeline or selection remain possible.
B6 / 1备用Backup
讲稿SCRIPT
Backup B6, on the outer fields. The naive comparison does suggest the outer halo is fainter, and that would be a scientifically interesting result. The problem is that the outer sample was observed before 2010 and the inner sample in 2017 and 2018, and in the outer sample the measured flux falls with year. So a radial difference and an epoch difference are the same difference in this dataset. When we match epochs the ratio drops from 0.80 to 0.54, and with only three post-2010 fields the error is large. The cause of the epoch effect is not established: it is not the solar cycle, but an instrument or pipeline change, or a selection effect, remain live. That is exactly why the matched-epoch re-extraction is the priority.
备用 B6,关于外场。朴素的比较确实暗示外晕更暗,这在科学上会是有趣的结果。问题是外场样本在 2010 年前观测,内场样本在 2017 和 2018 年,而外场样本中测得的流量随年份下降。所以在这个数据集里,径向差异和年代差异是同一个差异。当我们匹配年代,比值从 0.80 降到 0.54,而 2010 年后只有三个视场,误差很大。年代效应的原因尚未确立:不是太阳周期,但仪器或流水线变更、选择效应仍可能。这正是匹配年代重新抽取是优先任务的原因。
备用(不计时)backup (not timed)
备用 B7:总量是否移动由预先登记的规则决定,而不是由我们喜不喜欢Backup B7: Whether the Total Moves Is Decided by a Pre-Registered Rule, Not by Whether We Like the Answer
规则在任何模型敏感性结果被读出之前写好:只有当更灵活模型被 AIC 偏好超过 10,且移动超过一个统计误差(0.044)时,总量才改变。The rule was written before any model-sensitivity result was read: the total changes only if the more flexible model is preferred by AIC by more than 10 and the shift exceeds one statistical error (0.044).
实测:\(\Delta \mathrm{AIC}\) 在约 0 到 +2 之间(三个参考统计量分别为 +0.02、+0.5、+2.1),模型不被偏好。Measured: \(\Delta \mathrm{AIC}\) is between about 0 and +2 (+0.02, +0.5 and +2.1 against three reference statistics), so the model is not preferred.
规则因此判为结果 (c):保持 0.867,把 0.834 \(\pm\) 0.044 作为敏感性报告,不加进误差棒。The rule therefore returns outcome (c): keep 0.867 and report 0.834 \(\pm\) 0.044 as a sensitivity, not added to the error bar.
B7 / 1备用Backup
讲稿SCRIPT
Backup B7. The reason I can defend keeping 0.867 while reporting 0.834 is that the decision rule was written before the result existed. That is the whole point of pre-registration: it removes the temptation to pick the number you prefer after seeing both. The rule says the total moves only if the flexible model is clearly preferred and the shift is larger than the statistical error. Neither condition held, so the outcome was determined in advance.
备用 B7。我能为"保持 0.867 同时报告 0.834"辩护,原因是决定规则在结果存在之前就写好了。这正是预先登记的意义:它消除了看到两个数字后再挑选自己喜欢那个的诱惑。规则说,只有当灵活模型被明确偏好且移动大于统计误差时,总量才改变。两个条件都不满足,所以结果是预先决定的。
备用(不计时)backup (not timed)
备用 B8:小的两侧差只约束和,不约束任何一个星系Backup B8: A Small Side Difference Constrains Only the Sum, Not Either Galaxy
北/西北减南/东南 = 0.212 \(\pm\) 0.210(1.01\(\sigma\));分数不对称 0.212 \(\pm\) 0.230。这是一致性,不是不对称探测。North/NW minus South/SE = 0.212 \(\pm\) 0.210 (1.01\(\sigma\)); the fractional asymmetry is 0.212 \(\pm\) 0.230. This is consistency, not an asymmetry detection.
观测差只约束 \(\Delta S_{\rm obs} = \Delta S_{\rm MW} + W + \Delta S_{\rm M31}\);要归因到任一方,必须假设另一方在足迹上均匀或对称。The observed difference constrains only \(\Delta S_{\rm obs} = \Delta S_{\rm MW} + W + \Delta S_{\rm M31}\); attributing it to either side requires assuming the other is uniform or symmetric over the footprint.
几何也不平衡:10 对 4 个视场,中值半径差 4.31 kpc,南/东南在 20–25 kpc 无主场。The geometry is unbalanced too: 10 against 4 fields, median radii differing by 4.31 kpc, and no South/SE primary field at 20–25 kpc.
B8 / 1备用Backup
讲稿SCRIPT
Backup B8. If someone pushes on the spatial constraint, this is the slide. The algebra is one line: the observed side difference is the sum of a Milky Way difference and an M31 difference, so a small observed difference constrains the sum and nothing else. To turn it into an M31 asymmetry you must assume the Milky Way is uniform across the footprint; to turn it into a Milky Way variation you must assume M31 is symmetric. Neither assumption is in the data. And the two sides do not sample the same radii, so a side-only mean mixes radial and azimuthal structure.
备用 B8。如果有人追问空间约束,就是这张幻灯片。代数只有一行:观测到的两侧差是银河系差与 M31 差之和,所以一个小的观测差只约束和,不约束别的。要把它变成 M31 的不对称,必须假设银河系在足迹上均匀;要把它变成银河系的变化,必须假设 M31 对称。两个假设都不在数据里。而且两侧采样的半径不同,所以只按侧取均值会把径向和方位结构混在一起。
备用(不计时)backup (not timed)
备用 B9:本地热气泡分配取决于温度下界,所以它是"依赖下界"的Backup B9: The Local Hot Bubble Allocation Depends on the Temperature Floor, so It Is Floor-Dependent
气泡与冷成分归一化相关(−0.27 到 −0.65),所以沿轮廓放开气泡归一化会移动总量。The bubble and cool-component normalisations are correlated (−0.27 to −0.65), so profiling the bubble normalisation moves the total.
0.08 keV 下界:轮廓带半宽约 3.15 %,即 \(\pm 0.027\);高侧由 9/14 个视场钉在下界上决定。At the 0.08 keV floor the profile band has a half-width of about 3.15 %, i.e. \(\pm 0.027\) and the high side is set by 9 of 14 fields pinned at the floor.
放到 0.05 keV:带变为 −0.9 % 到至少 +4.1 %,上界受网格边缘限制,因此是下界。Relaxing to 0.05 keV changes the band to −0.9 % to at least +4.1 %, with the upper end grid-edge limited and therefore a lower bound.
B9 / 1备用Backup
讲稿SCRIPT
Backup B9. This is the one systematic whose size is set by a modelling choice rather than by the data. The Local Hot Bubble sits at a lower temperature than the component we measure, and the two normalisations are anti-correlated, so where we put the bubble's lower temperature bound changes how much flux it takes. At 0.08 keV the band is symmetric to within half a percent and we quote plus or minus 0.027. Relax the floor to 0.05 keV and the band becomes asymmetric, minus 0.9 percent to at least plus 4.1 percent, with the upper end limited by the edge of our grid. So the honest label is floor-conditional, and I would rather explain that than quote one symmetric number.
备用 B9。这是唯一一个大小由建模选择而非数据决定的系统项。本地热气泡的温度低于我们测的成分,两者归一化反相关,所以我们把气泡温度下界放在哪里,会改变它取走多少流量。在 0.08 keV,带在半个百分点内对称,我们报 \(\pm 0.027\)。把下界放宽到 0.05 keV,带变成非对称的,−0.9% 到至少 +4.1%,上界受我们网格边缘限制。所以诚实的标签是"依赖下界",我宁愿解释这一点,也不报一个对称的单一数字。
备用(不计时)backup (not timed)
备用 B10:投稿前仍缺的七项,以及它们为什么是阻塞项Backup B10: The Seven Items Still Missing Before Submission, and Why They Block
1. 匹配的空间似然:一个共同的径向函数加两侧偏移,而不是两侧均值。1. A matched spatial likelihood: one common radial function plus a side offset, not two side means.
2. 边界感知的推断:多重起点、轮廓、模拟校准的单侧覆盖度。2. Boundary-aware inference: multistart, profiling, simulation-calibrated one-sided coverage.
3. 受控系统项网格:吸收、软质子、宇宙背景、SWCX、丰度、能段、仪器线翅膀。3. A controlled systematic grid: absorption, soft protons, CXB, SWCX, abundance, band, instrumental-line wings.
4–7. 定量的约束产品;上游耀发/定标/掩模规则的恢复;头条数字在全估计量集上的一致传播;模型敏感性的收尾。4–7. A quantitative constraint product; recovery of the upstream flare, calibration and mask rules; consistent propagation of the headline number across the whole estimator set; completion of the model-sensitivity work.
B10 / 1备用Backup
讲稿SCRIPT
Backup B10, if someone asks what is left before this is a paper. The list is on the slide. The two that matter most scientifically are the matched spatial likelihood, because the side means are not the final statistic, and the systematic grid, because three named systematics are currently unbounded. The others are provenance and documentation: we can reproduce our own products but we cannot bitwise rebuild them from the raw data, because the upstream flare thresholds and calibration identity are not recoverable, and that has to be fixed and frozen before submission.
备用 B10,如果有人问在这成为一篇论文之前还缺什么。清单在幻灯片上。科学上最重要的两个是匹配的空间似然,因为两侧均值不是最终统计量;以及系统项网格,因为三个具名系统项目前没有界定。其余是溯源和文档:我们可以复现自己的产品,但不能从原始数据逐位重建,因为上游耀发阈值和定标身份不可恢复,这必须在投稿前修正并冻结。
备用(不计时)backup (not timed)